Solar panel calculator: generation, savings and payback
Numbers checked against official sources on 7 October 2026
Estimate what solar panels would generate on your roof, what they would save, and how long they take to pay back. Generation figures come from the EU’s PVGIS solar database for UK cities; prices start from the October 2026 price cap. Change anything to match your quote.
A simple estimate: it ignores panel ageing, future price changes, inverter replacement and financing. Everything is calculated in your browser; nothing is sent to us.
How the calculator works
Generation = kWh per kWp for your area × roof factor × system size Bill saving = generation × share you use × electricity price Export = generation × share you export × export rate Payback = installed price ÷ (bill saving + export)
The generation figures come from PVGIS, the European Commission’s free solar estimating tool, using satellite data for 2005 to 2020, panels tilted at 35° and 14% system losses. We ran it for one city in each area on 7 October 2026. Your installer should give you a site-specific estimate that includes shading.
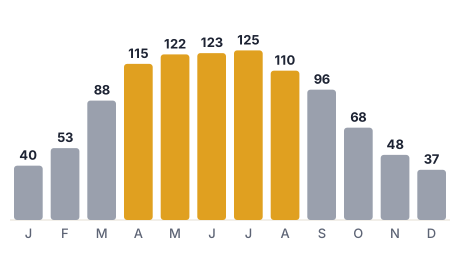
In London, July produces more than three times as much as December. That is why the share you use yourself matters: in summer you will export much of what you make unless you shift usage into the day or store it.
How our results compare with the Energy Saving Trust
With the default settings for London (4.5 kWp, £7,600, half used at home, 12p export), the calculator gives a payback of about 8.6 years. The Energy Saving Trust estimates about 9 years for London for a typical system at July 2026 prices (EST). For Stirling the calculator gives about 10 years against EST’s 11 to 12. The gap comes from different assumptions about self-use and export rates, which is exactly why you should change them to match your household. Solar panel costs in 2026.
Frequently asked questions
How much electricity does a 4.5 kWp solar system make in the UK?
Facing south, roughly 3,900 kWh a year in central Scotland to about 4,900 kWh in the South West, based on PVGIS. East or west roofs make about 20% less.
What share of my solar will I use myself?
It depends on when you are at home and what you run during the day. We use 50% as a starting assumption; a battery or daytime usage pushes it higher. Your smart meter data after installation gives the real figure.
Why does the export rate matter so much?
Every kWh you export earns the export rate, which can be anything from 2p to 20p, while every kWh you use saves the full electricity price, around 26p at the October 2026 cap. See our export rates guide.
Is my data stored?
No. The calculator runs in your browser and sends nothing to us.